

“Is it going to rain on Friday?”
If you’re looking to answer this question, you might go to a weather forecasting site, where you’d see something similar to this:
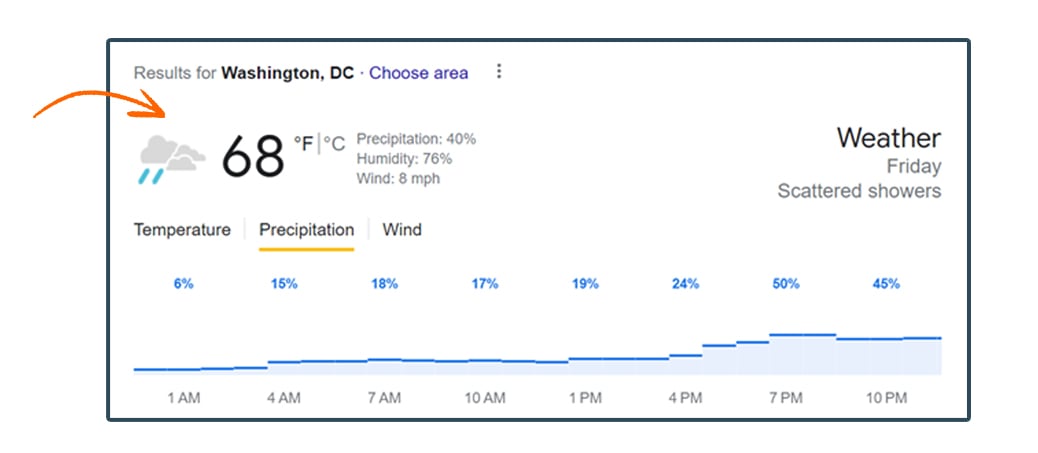
40% chance of precipitation. This is a probabilistic forecast – the prediction is expressed in terms of the probability of different events occurring. It would be way less useful if I asked, “Is it going to rain on Friday” and you said, “No.” This is a single-valued forecast.
In Agile, we often get the question, “When is this work going to be completed?” What I see most frequently is the Scrum Master taking the team’s velocity and dividing it by the estimated number of story points to be done. So, if your team’s velocity is 4, and you have 40 story points to complete, then the whole scope would be completed in 10 sprints.
This is a good place to start. However, this method gives a single-valued forecast with no communication of the likelihood of hitting this target. Generally, the likelihood of hitting the date using this model is 50% because you’re using the mean throughput (velocity). This process also requires you to estimate a bunch of small pieces of work (time intensive) or take a high-level estimate of the size of a big body of work, which adds lots of room for error.
Is there a better way to provide Agile estimates?
Enter Monte Carlo Simulations
Agile teams can leverage the powerful tool of a Monte Carlo simulation to generate a probabilistic forecast.
At its most basic premise, a Monte Carlo simulation runs thousands of simulated experiments and gives the probability of different outcomes occurring.
How can you use this for Agile Forecasting?
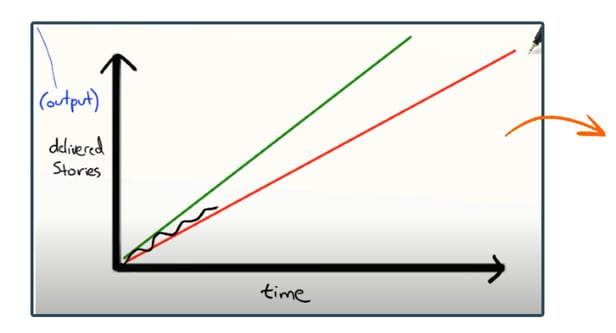
There are a few ways you can generate a probabilistic Agile forecast. One way is with an Optimistic and Pessimistic trendline. There are some automated reports that can help you generate these trends (such as the Jira Align Program Increment Burndown report) or you can manually estimate the trend lines like seen in the image below (from this video at 12:24).
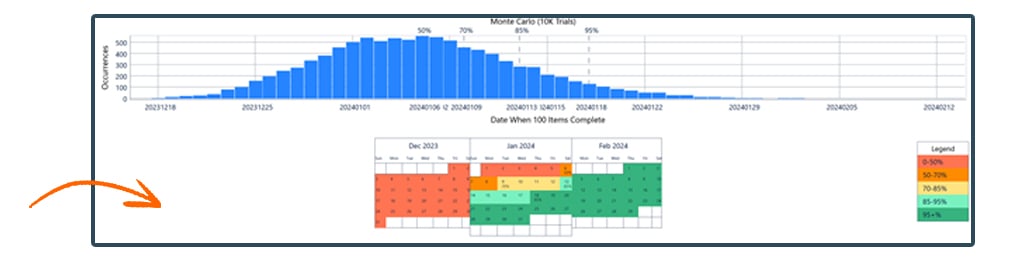
Another option is to use the cycle time data to make the forecast. Actionable Agile provides an add-on that actual Jira cycle time data to run Monte Carlo simulations to estimate when your work will be done. Take the screenshot below, which uses sample data. Based on the team’s sample data, If you needed to provide an estimate for when 100 items would be completed, based on a start date of 12/1, you can see that the simulation yields that you’d have a 50% chance of being completed by 1/6, a 70% chance of being completed by 1/9, and an 85% chance of completion by 1/13 (ignoring time off for holidays!)
Don’t have access to the Actionable Agile add-on? Check out a free spreadsheet option. As a super low-tech solution, start tracking the cycle time for your team, and manually calculate the median, 70th percentile, and 85th percentile cycle time for your team. By using those 3 data points, you can create a probabilistic forecast, without using the Monte Carlo simulations from the add-on or spreadsheet, and still give a more robust forecast than using velocity alone.
More and better data gives you a better prediction
Both of these prediction techniques leverage your historical delivery information to drive the prediction. A few key attributes will drive a better prediction:
- The more meaningful data you have, the better. As with any dataset, the more meaningful data you have, the better the model can forecast. What do I mean by meaningful data? The past work is similar to the work you’re hoping to forecast. Is the team the same? Is the type of work the same? When discussing how much work should be in your data set, while more is better, I would aim for at least 3-5 sprints’ worth.
- Reliable delivery becomes a big lever in your forecasts. If your past work has lots of variability in cycle time (sometimes stories are done in 1 day, and sometimes they’re done in 10), that variability will show up in your estimate, causing a wider range of estimated completion dates. So, I recommend working with your team on getting reliable delivery times, ideally by breaking work down to the smallest sizes possible, so the team can deliver quickly and reliably.
Does it work?
The most important element of probabilistic forecasting is that it allows you to express the degree of uncertainty in your forecast. We often think about a project forecast being “accurate” – did we finish the work by the date we projected? With probabilistic forecasting, we change the thought process about whether the forecast was “correct”. If we predict that we will get a certain amount of work done by a date with 85% certainty, and we don’t hit the target, our forecast wasn’t necessarily wrong – we would expect this outcome 15% of the time.
Have you tried using probabilistic forecasting? Reach out and let us know!